(1) Recap
- bias/systematic error
- random measurement error
- Reading Histograms
(2) Measurement Error
- Why does it happen?
- What are the consequences?
October 9, 2025

random measurement error: errors that occur due to random features of measurement process. Even if observed values are sometimes wrong, they are, on average, correct
bias or systematic measurement error: error produced when our measurement procedure obtains values that are, on average, too high or too low (or incorrectly labelled) compared to the truth.
…if there is measurement error?
We only observe what we observe, rarely the true value. We often only can imagine a story about why there would be measurement error.
How do we know procedure does not return the true value?
…if there is measurement error?
Measurement error is everywhere. Does not mean we can say nothing about descriptive claims.
Systematic Measurement Error (bias) arises from observations made by and of people:
(\(1\)) Subjectivity/Perspective: Researcher/data collector/“witness” systematically perceives and evaluates cases incorrectly
Examples:
(\(2\)) Motives/Incentives to mis-represent: beyond researchers, people generating the data
If we surveyed Canadians and asked them:
“Do you support stopping all immigration into Canada?”
They can choose “oppose”, “support”, “neither support nor oppose”
Do you think this survey response would suffer from measurement bias?
When discussing crime rates for natural-born citizens, legal immigrants, and undocumented immigrants, need to get the number of undocumented immigrants.
Why might it be difficult to correctly count?
What is the direction of the bias?
(\(3\)) Use of data beyond its intended purposes: without knowing how data is produced, unanticipated errors can arise.
Kennedy et al, argue:
It takes time for undocumented immigrants in custody to be identified.
Only people in custody for longer periods of time for serious crimes likely to be thoroughly checked:

Alex Nowsrateh shows that these conclusions came from misunderstanding of the Texas data:
Kennedy et al takes count of all incidents where people labelled as undocumented from DHS and TDCJ. May double count individuals.
“We can supply the number uniquely identified by TDCJ (Prison category) and the total number of Illegals identified through PEP (this can include illegals also identified by TDCJ). Please note, if someone was uniquely identified through TDCJ, but at a later time is identified through PEP, the individual would no longer be in the Prison category and would reflect the PEP identification” [emphasis added].


Anything that is unrelated to the actual values for the cases, and equally likely to over-/under-estimate.
Unless the error is literally generated at random, e.g. rolling dice, we only assume/argue that it is random
Kalmoe and Mason measure “Support for Political Violence” by surveying people
Variable: Percent of people who believe it is justified for people with similar political beliefs to use violence in politics.
Measure:
Administered on online survey of a national stratified sample of Americans. Ask respondents the following question:
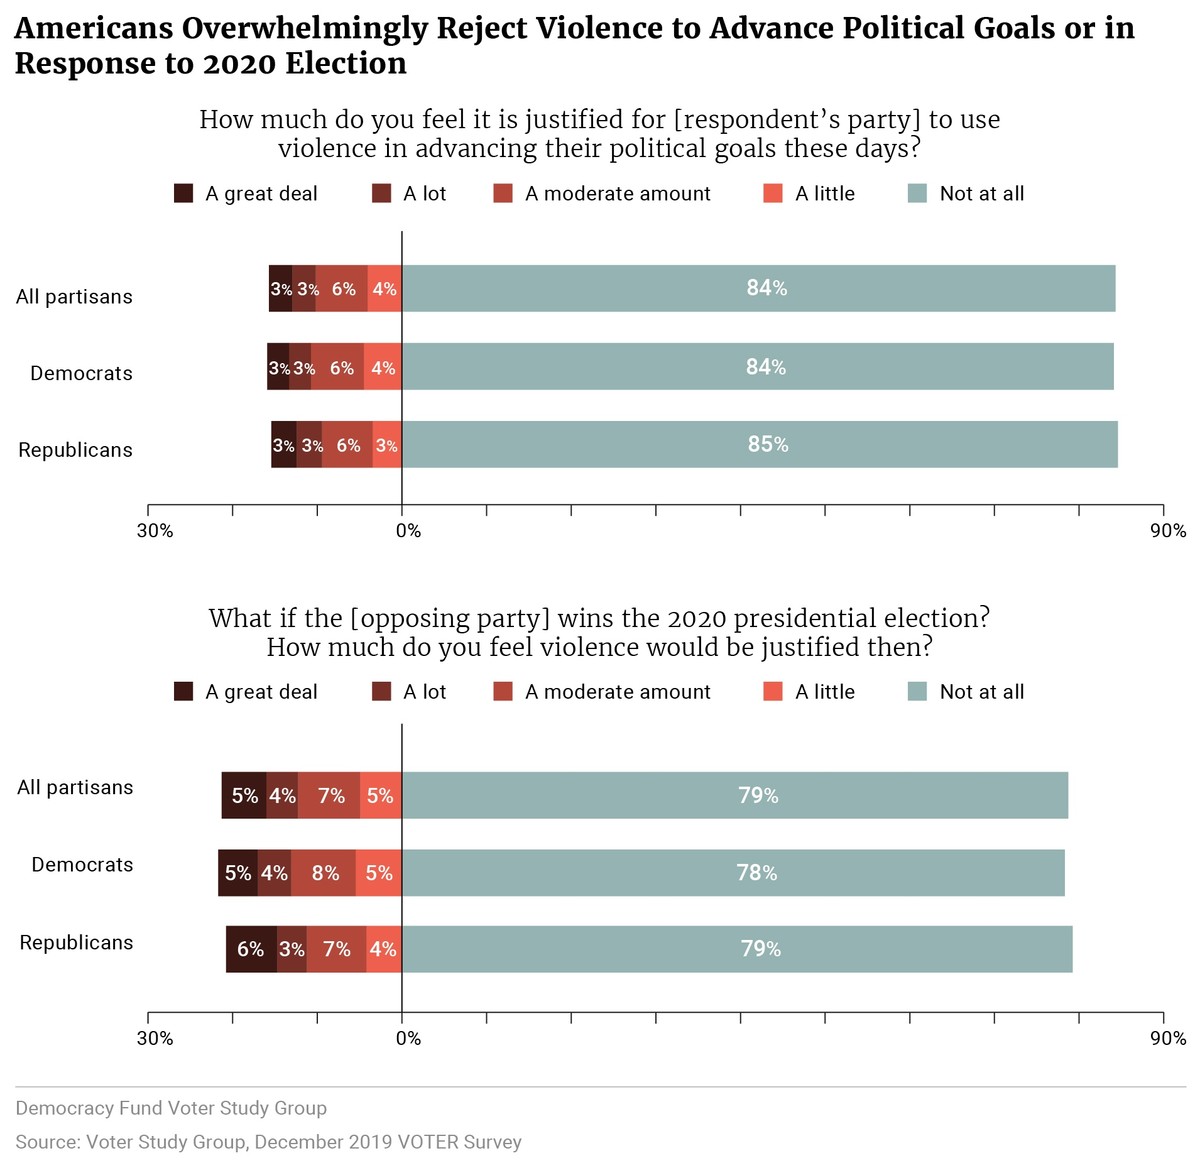
“How much do you feel it is justified for [respondent’s own party] to use violence in advancing their political goals these days?”
Respondents can choose from “Not at all”, “a little”, “a moderate amount”, “a lot”, “a great deal”
Code “support” for political violence as answering “a little”, “a moderate amount”, “a lot”, “a great deal”
Measure:
Administered on online survey of a national stratified sample of Americans. Ask respondents the following question:
“How much do you feel it is justified for [respondent’s own party] to use violence in advancing their political goals these days?”
Respondents can choose from “Not at all”, “a little”, “a moderate amount”, “a lot”, “a great deal”
Code “support” for political violence as answering “a little”, “a moderate amount”, “a lot”, “a great deal”>
They find that ~30% of Americans “supported” political violence
Discuss: Likely to suffer from measurement error? (Are people answering with their true belief?) What type? Why?
In online surveys, many respondents are:
On this question: random click leads to indicating “support for political violence” 80% of the time: random error or bias?
Just a story… is this measurement bias real?
Westwood et al (2022) ask similar questions on a survey:

If the claim is that “At least one in three Americans think political violence is justified”…
How would the bias we’ve uncovered affect our interpretation of the surveys finding ~30% support for political violence?
Not always a problem. When is it a problem?
\(1.\) Evidence and bias are in the same direction:
Evidence supports the claim and bias is toward supporting the claim. (Kennedy et al and violent crime by undocumented migrants)
or
Evidence rejects the claim and bias is toward rejecting the claim.
Not always a problem. When is it a problem?
If the bias makes harder to support the claim, and we nevertheless find evidence in favor of the claim, this is strong severity.
We claim that “At least 10 percent of Canadians support stopping immigration” and we observe using this survey question
“Do you support stopping all immigration into Canada?”
that 11 percent of Canadians answer yes.
Not always a problem. When is it a problem?
\(2.\) When the magnitude of the bias is large enough to change the conclusion from the evidence
Nowsrateh pointed out that Kennedy et al double counted undocumented migrants in prison for violent crimes.
Not always a problem. When is it a problem?
\(3.\) If claims are about absolute levels
Claims about absolute levels of, e.g. support for political violence, crime, sexual misconduct
Any measurement bias can lead to under/over-count
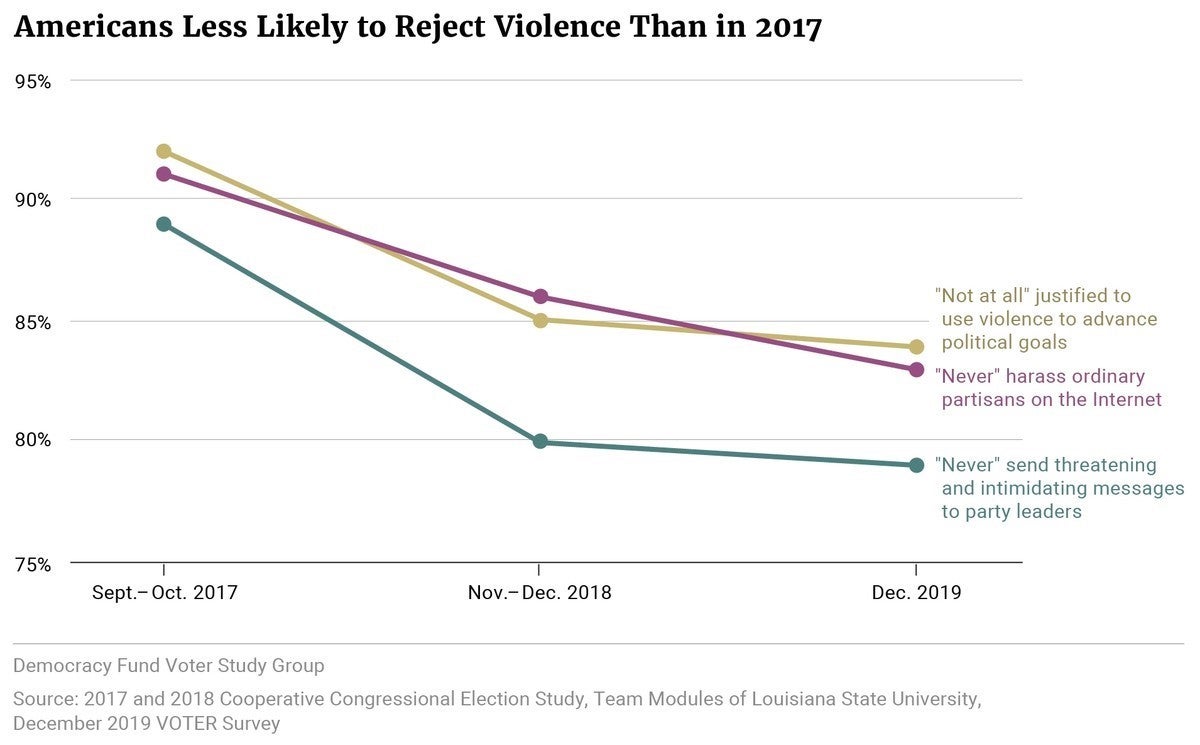
Claim: Beliefs that “political violence is never justified” have declined.
Using same question as above: could measurement bias \(\to\) accept claim even when it is wrong?
Not always a problem. When is it a problem?
No problem If claims are about relative levels (across cases, over time) and measurement bias is the same (across cases, over time)
Claim: “Support for political violence in the US is higher than 20%.”
We a run a survey:
\(4.\) Random errors are a problem when magnitude is large and we make few observations
Measurement Error