1. Fundamental Problem of Causal Inference
- independent/dependent variables
- solutions
2. Correlation
- what is it?
- problems with correlation
- Random association
November 4, 2025
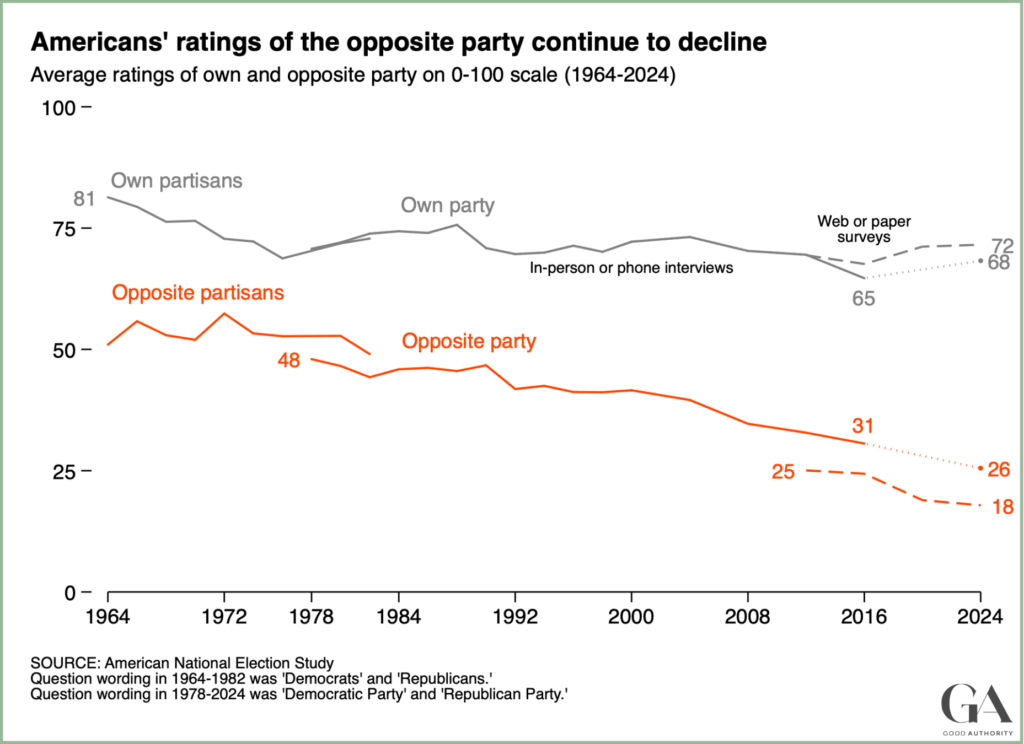
If we identify polarization as a problem, addressing it requires understanding what are its causes.
Claim: “Getting political information social media increases political polarization.”
Evidence for this claim?
Independent variable:
The variable capturing the alleged cause in a causal claim.
Dependent variable:
The variable capturing the alleged outcome (what is affected) in a causal claim.
Potential Outcomes are the values of dependent variable a case would take if exposed to different values of the independent variable
Dependent Variable: Polarization
Independent Variable: Polarization

Even if social media use didn’t increase polarization…
Could we see this evidence (US has both social media use and polarization)?
when attempting to provide evidence for causal claims, selectively observing cases based on the outcome they experience
Problem 1: creates opportunity for “Texas Sharpshooter Fallacy”

“Fence” is case with outcome “high polarization”; “bullet holes” are attributes of that case
Problem 2: Causality is counterfactual. Outcome should be different when independent variable changes. Selecting on dependent variable: never observe outcome under different exposure to the “cause”.
Causality is counterfactual: Need to observe the outcome/dependent variable in a case at different levels of the cause/independent variable.
\[\text{Polarization}_{USA} (\text{High Social Media Use}) = High \\ \color{red}{\text{Polarization}_{USA} (\text{Low Social Media Use}) = ?} \] but we can never observe the \(\color{red}{\text{counterfactual}}\)… \(\to\) Fundamental Problem of Causal Inference
If getting news from social media increased polarization
\(\color{red}{\mathrm{Polarization}_{USA}(\mathrm{Higher \ Social \ Media})} >\) \(\mathrm{Polarization}_{USA}(\mathrm{High \ Social \ Media}) >\) \(\color{red}{\mathrm{Polarization}_{USA}(\mathrm{Low \ Social \ Media})}\)
In order to provide evidence for causal claims, we need to find ways around the FPCI:
| \(\mathrm{Country}_i\) | \(\mathrm{Social \ Media}_i\) | \(\mathrm{Polar.}_i(\mathrm{Low \ S.M.})\) | \(\mathrm{Polar.}_i(\mathrm{High \ S.M.})\) |
|---|---|---|---|
| USA | High | \(\color{red}{\mathrm{Polar.}_{USA}(\mathrm{Low \ S.M.}) = ?}\) | \(\mathrm{Polar.}_{USA}(\mathrm{High \ S.M.})\) |
How could we observe “\(\color{red}{?}\)”, the unknown counterfactual?
We cannot observe: \(\color{red}{\mathrm{Polar.}_{USA}(\mathrm{Low \ S. M.})}\)
But we can observe, e.g.: \(\mathrm{Polar.}_{Germany}(\mathrm{Low \ S. M.})\)
| \(\mathrm{Country}_i\) | \(\mathrm{Social \ Media}_i\) | \(\mathrm{Polar.}_i(\mathrm{Low \ S.M.})\) | \(\mathrm{Polar.}_i(\mathrm{High \ S.M.})\) |
|---|---|---|---|
| USA | High | \(\color{red}{\mathrm{Polar.}_{USA}(\mathrm{Low \ S.M.})= ?}\) | \(\mathrm{Polar.}_{USA}(\mathrm{High \ S.M.})\) |
| \(\mathbf{\Uparrow}\) | |||
| Germany | Low | \(\mathrm{Polar.}_{Germany}(\mathrm{Low \ S.M.})\) | \(\color{red}{\mathrm{Polar.}_{Germany}(\mathrm{High \ S.M.})}\) |
If we assume:
\(\mathrm{Polar.}_{Germany}(\mathrm{Low \ S.M.})\) \(=\) \(\color{red}{\mathrm{Polar.}_{USA}(\mathrm{Low \ S.M.})}\)
Then, we can empirically test our causal claim
plugging in factual \(Germany\) for the counterfactual \(USA\)
| \(\mathrm{Country}_i\) | \(\mathrm{Social \ Media}_i\) | \(\mathrm{Polar.}_i(\mathrm{Low \ S.M.})\) | \(\mathrm{Polar.}_i(\mathrm{High \ S.M.})\) |
|---|---|---|---|
| USA | High | \(\mathrm{Polar.}_{Germany}(\mathrm{Low \ S.M.})\) | \(\mathrm{Polar.}_{USA}(\mathrm{High \ S.M.})\) |
| \(\mathbf{\Uparrow}\) | |||
| Germany | Low | \(\mathrm{Polar.}_{Germany}(\mathrm{Low \ S.M.})\) | \(\color{red}{\mathrm{Polar.}_{Germany}(\mathrm{High \ S.M.})}\) |

48% of Americans report using social media for news. \(\mathrm{Polarization}_{USA}(\mathrm{Social \ Media \ News =48\% }) = 56\)

37% of Germans report using social media for news. \(\mathrm{Polarization}_{Germany}(\mathrm{Social \ Media \ News =37\% }) = 29\)


Every solution to the FPCI involves:
Comparing the observed values of outcome \(Y\) in cases that factually have different values of cause \(X\)
Making assumption that factual (observed) potential outcomes from one case as equivalent to counterfactual (unobserved) potential outcomes of another case.
Correlation is the association/relationship between the observed/factual values of \(X\) (the independent variable) and \(Y\) (the dependent variable)
All empirical evidence for causal claims relies on correlation between the independent and dependent variables.
But, you’ve all heard this:

Many different ways of assessing correlation, but shared attributes:
Stronger
Weaker
Many different ways of assessing correlation, but shared attributes:
Many ways of examining correlations:
Scatterplot
Bar plot

Individual data on social media use and affective polarization from ANES 2024
Trend lines

common mathematical definition: correlation is the degree of linear association between \(X\) and \(Y\)
negative correlation: (\(< 0\)) values of \(X\) and \(Y\) move in opposite direction:
positive correlation: (\(> 0\)) values of \(X\) and \(Y\) move in same direction:

It is possible to see perfect correlation but small (magnitude) change in \(Y\) across \(X\)
It is possible to see weak correlation but large (magnitude) change in \(Y\) across \(X\)
It is possible to see perfect nonlinear relationship between \(X\) and \(Y\) with \(0\) correlation
weak correlation: values for \(X\) and \(Y\) do not cluster along line
strong correlation: values for \(X\) and \(Y\) cluster strongly along a line
strength of correlation does not determine the slope of line describing \(X,Y\) relationship
magnitude: this is the slope of the line describing the \(X,Y\) relationship. The larger the effect, the steeper the slope
Correlation: \(0.25\), Magnitude: \(0.23\). Does this correlation prove using social media for news causes polarization? Why or why not?

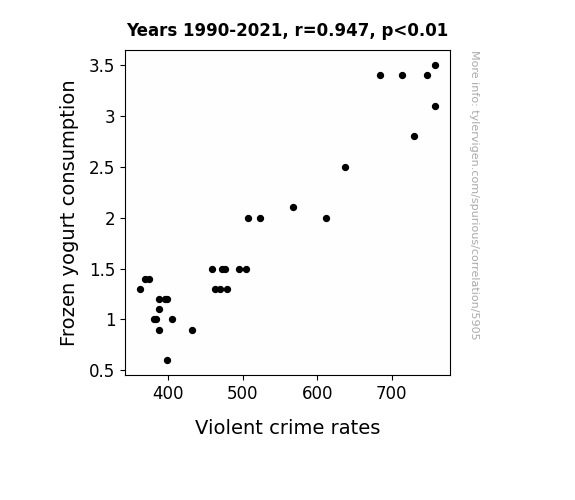
Correlation: 0.67, Magnitude: 5.82. Does this correlation prove that X caused drownings? Why or why not?

Correlation: 0.67, Magnitude: 5.82. Does this correlation prove that Nic Cage films caused drownings? Why or why not?
random association: correlations between \(X\) and \(Y\) occur by chance and do not reflect any systematic relationship between \(X\) and \(Y\). (In the extreme, absolutely no relationship between \(X\) and \(Y\))
bias (spurious correlation, confounding): \(X\) and \(Y\) are correlated but the correlation does not result from causal relationship between those variables
Solving these problems involves making assumptions: what are those assumptions? how plausible are they?
Arbitrary processes can make seemingly-strong patterns.
If you look long enough at pure chaos, you might find a strong correlation
To see that random patterns can emerge, I use random number generators to
We can imagine these are the observed \(X\) and \(Y\) for \(5\) cases.

Could we find a strong correlation between \(X\) and \(Y\) (even if \(X\) and \(Y\) totally unrelated)?
\(\#\) Tries to get correlation \(> 0.9\): 22
What do we do about this problem?
This procedure works…

Tries to get correlation \(> 0.9\): 2134

Tries to get correlation \(> 0.9\): 452969

Tries to get correlation \(> 0.45\): 15
statistical significance:
An indication of how likely it is that correlation we observe could have happened purely by chance.
higher degree of statistical significance indicates correlation is unlikely to have happened by chance. (unlikely to observe evidence for the claim if claim is false)
\(p\) value:
\(p < 0.05\) often used as threshold for “significant” result.
\(p\) value:
Advertised promise about weak severity:
if we use this correlation as evidence in support of a claim, what is probability of accepting the claim in error (due to random association)?


\(p\) value:
Be wary of “\(p\)-hacking”/“snooping”

Correlation: 0.67, \(p \le\) 0.025: 1 in 40 chance is easy to find when you look at 25 thousand possible correlations.
| Statistical Significance |
\(p\)-value | By Chance? | Why? | “Real”? |
|---|---|---|---|---|
| Low | High \((p > 0.05)\) | Likely | small \(N\) weak correlation |
Probably not |
| High | Low \((p < 0.05)\) | Unlikely | large \(N\) strong correlation |
Possibly |
Correlation: 0.25, \(p \le\) 0.428
Does social media used cause polarization?
Correlation: 0.07, \(p \le\) 0.0000020
Does social media used cause polarization?
\(1.\) Correlation as “solution” to Fundamental Problem of Causal Inference
\(2.\) Correlation suffers from two problems: